
As the first quarter of the year gracefully concludes, we’re taking a moment to reflect on the dynamic landscape of March. While the initial months of January and February presented their unique challenges, characterized by a slight dip in overall engagement, we’re thrilled to report a robust resurgence in website traffic. This period, often marked by seasonal fluctuations, has ultimately demonstrated the resilience of consistent content creation and strategic digital marketing efforts.
Spring break, predictably, brought a noticeable slowdown in user activity, a common trend for many online platforms as audiences shift their focus to real-world activities. However, the closing weeks of March painted a far more optimistic picture, signaling a strong rebound and setting a positive tone for the upcoming quarter. This detailed recap serves not just as a financial and analytical summary, but as a transparent look into the strategies, successes, and ongoing learning journey within the competitive world of food blogging.
Google Analytics Summary: Unpacking Our Audience Engagement
Google Analytics remains our indispensable compass, guiding our understanding of how users interact with our content. Analyzing these metrics provides critical insights into what resonates with our audience, where they come from, and how we can optimize their experience on our food blog. March’s data offers a detailed picture of both successes and areas ripe for strategic development.
Overview of Key Performance Indicators
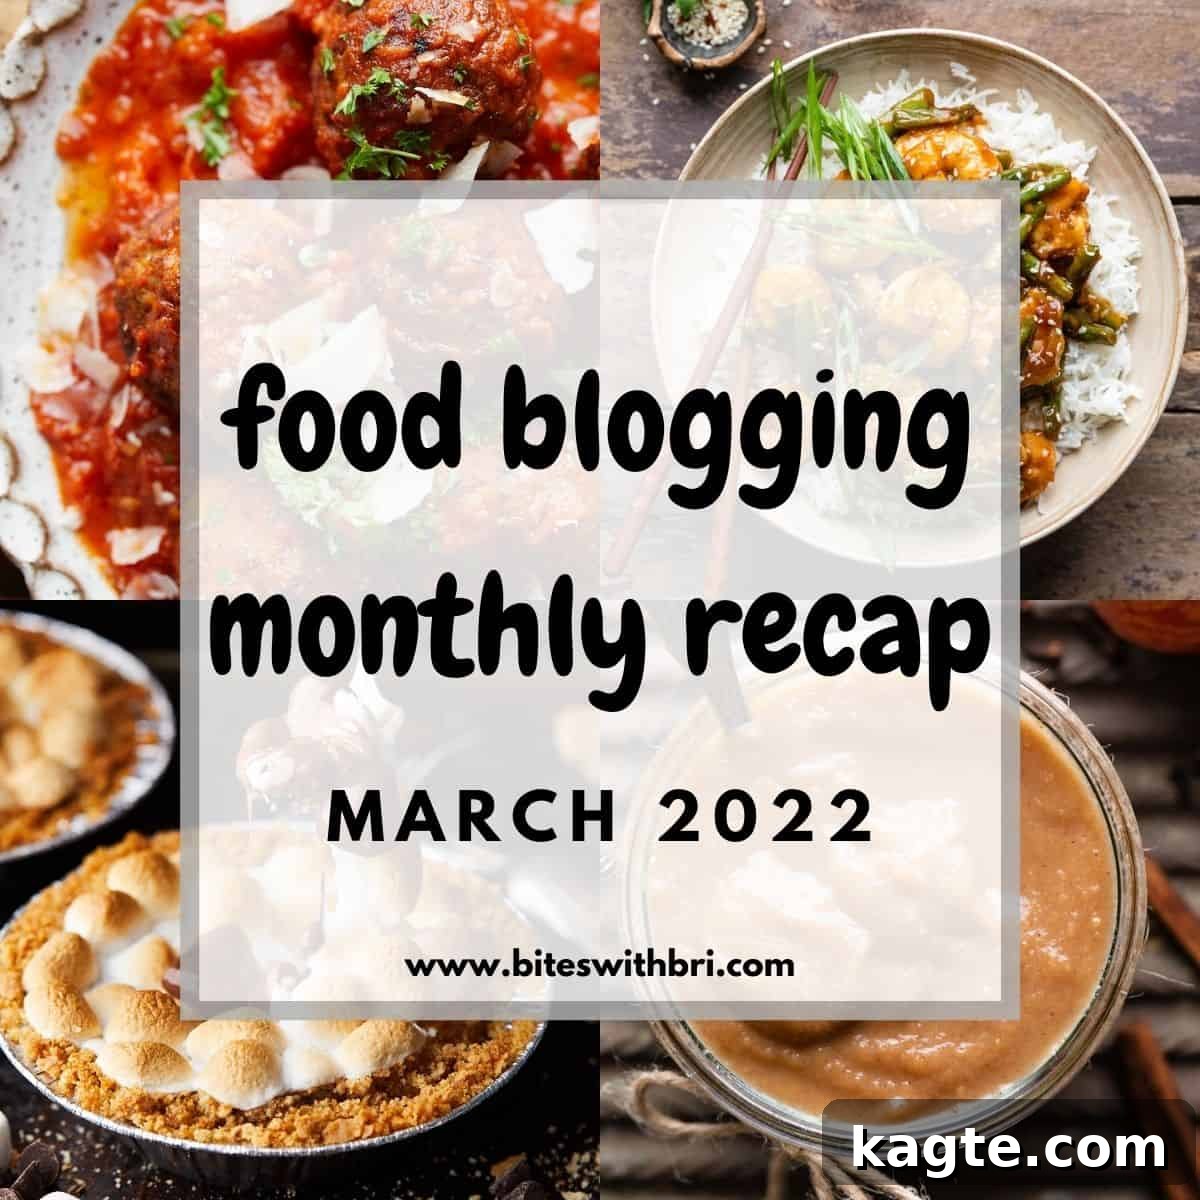
Understanding the core metrics is essential for evaluating overall website health and growth. Here’s a quick look at March’s vital statistics:
- Sessions: 41,874
- Pageviews: 48,121
- Users: 37,178
These numbers represent the total engagement over the month. “Users” indicates the number of unique individuals visiting the site, while “Sessions” refers to the total number of visits, meaning a single user can generate multiple sessions. “Pageviews” tracks the total number of pages viewed, including multiple views of the same page by a user within a session. The ratio of pageviews to sessions suggests healthy user engagement, with visitors exploring more than one page per visit.
Acquisition: Where Our Audience Comes From
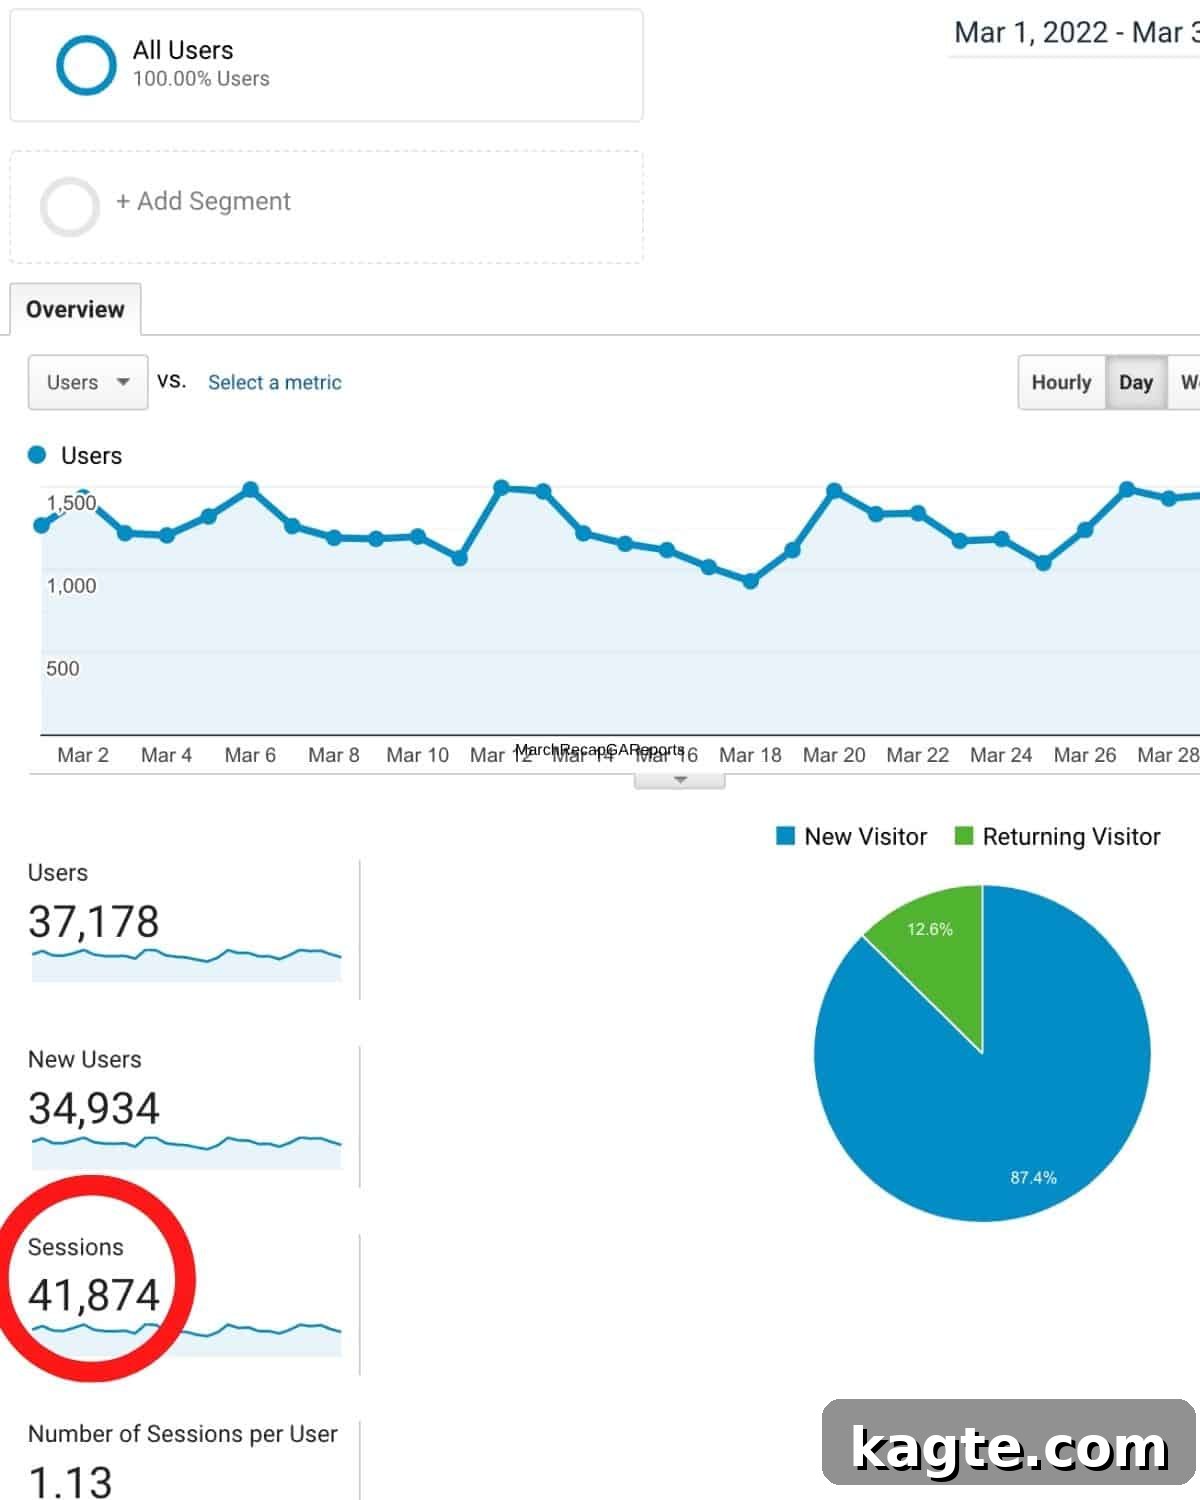
Understanding acquisition channels is crucial for optimizing marketing efforts and allocating resources effectively. Here’s a breakdown of how users discovered our content in March:
- Organic Search: 26,897
Organic search traffic, originating from search engines like Google, Bing, and others, remains the bedrock of sustainable blog growth. It’s the primary metric we scrutinize month-over-month, as it signifies the effectiveness of our SEO strategy and the relevance of our content to user queries. While our goal is a consistent 10-20% month-over-month growth, March saw a slight dip compared to January. This is not entirely unexpected in the seasonal ebb and flow of a food blog, where interest in certain recipes peaks during specific times of the year. To counteract this natural seasonality, we have been proactively publishing a substantial volume of fresh, high-quality, and SEO-focused content. Our long-term vision for food blogging is clear: it’s a marathon, not a sprint. We continue to “double down” on proven strategies, specifically by investing heavily in comprehensive keyword research and crafting content that not only answers user questions but also delights them with delicious recipes and valuable information. This consistent effort is designed to build evergreen traffic that withstands seasonal shifts.
- Direct: 5,419
Direct traffic refers to visitors who type our URL directly into their browser, use a bookmark, or click on an untracked link. This channel held steady compared to the previous month, which is a positive indicator of returning visitors and growing brand recognition. A consistent direct traffic volume suggests a loyal readership base that actively seeks out our content, reinforcing the value of building a strong brand identity.
- Social: 6,757
Social media platforms continue to be a significant, albeit sometimes volatile, source of traffic. Our strategy involves a multi-platform approach:
- Pinterest: 3,744
Pinterest traffic has unfortunately continued its downward trend. As a visual search engine, Pinterest offers immense potential for food bloggers, but its algorithm changes and competitive landscape make consistent growth challenging. We are closely monitoring its performance and, despite the recent decline, have committed to a year-long management service to give this platform a final, dedicated push. Our hope is that professional management and updated strategies will reverse this trend and unlock its full potential for recipe discovery.
- Facebook: 2,920
Facebook traffic experienced a decline in March. This can largely be attributed to a less consistent effort in sharing recipes within relevant community groups compared to February. Maintaining a steady presence and active engagement on Facebook requires diligent scheduling and participation. We recognize this gap and are prioritizing more consistent sharing and interaction within recipe-focused groups in the coming month to recapture and grow this valuable traffic segment.
- Instagram & Instagram Stories: 88 (does not include tap bio)
While the direct referral numbers from Instagram appear modest, it’s important to note that this figure doesn’t encompass clicks via “tap.bio” links or direct searches prompted by Instagram content. Instagram plays a crucial role in brand building, visual storytelling, and fostering community, often leading to indirect traffic or brand loyalty rather than immediate click-throughs.
- Pinterest: 3,744
- Referral: 2,772
Referral traffic comes from other websites linking to our content. This category often highlights successful collaborations, mentions, or the impact of specific content formats:
- biteswithbri-com.cdn.ampproject.org: 2,006 (web stories)
A significant portion of our referral traffic came from our Web Stories, specifically via the AMP project. Web Stories are full-screen, tap-through visual narratives that offer an immersive way to consume content. Their strong performance here underscores their potential for discoverability and driving traffic to our main blog posts, especially through Google Discover.
- tap.bio: 219
Tap.bio serves as a centralized link-in-bio tool for social media platforms, particularly Instagram, allowing us to direct followers to multiple key destinations. This consistent referral traffic indicates its effectiveness in guiding our social audience to desired content.
- biteswithbri-com.cdn.ampproject.org: 2,006 (web stories)
- Other: 29
This category encompasses various minor or uncategorized traffic sources, typically representing a small fraction of overall acquisition.
Ahrefs Summary: Monitoring Our SEO Health and Authority
Beyond surface-level traffic, SEO tools like Ahrefs provide a deeper look into our website’s authority, backlink profile, and keyword performance. These metrics are crucial for understanding our competitive standing and the long-term impact of our off-page SEO efforts.
- Domain Rating (DR): 26
Domain Rating (DR) is Ahrefs’ proprietary metric that measures the strength of a website’s backlink profile on a 100-point scale. A higher DR indicates greater authority and potential for ranking well in search results. While our DR experienced a slight fluctuation this month, decreasing slightly from its previous standing, this is not an immediate cause for concern. DR can naturally fluctuate as Ahrefs updates its index and algorithms. Our focus remains on acquiring high-quality backlinks and producing valuable content, which will organically improve this metric over time. We will continue to monitor this closely in the subsequent months.
- Total Keywords: 17,489
The total number of keywords our site ranks for saw a minor decline this month. However, a more critical indicator is the performance of our top-ranking keywords. We’ve observed that rankings within the coveted top 3 positions have remained stable, meaning this overall decline hasn’t translated into a corresponding drop in organic search traffic. This reinforces the idea that quality often trumps quantity when it comes to keyword rankings. Our strategic emphasis is on achieving high rankings for commercially viable and high-volume keywords, rather than simply increasing the total number of long-tail keywords. This holistic approach ensures that the keywords we *do* rank for are driving meaningful traffic and conversions.
Analyzing Ahrefs data in conjunction with Google Analytics allows us to connect our SEO efforts directly to traffic generation. The subtle shifts in DR and total keywords are part of the ongoing optimization process, and our sustained performance in top keyword positions is a positive sign of our SEO foundation.
Income: Monetization and Reinvestment in Our Food Blog
Monetizing a food blog involves a diverse array of income streams, each contributing to the overall financial health and sustainability of the business. March’s income report highlights the effectiveness of our current monetization strategies and our commitment to reinvesting profits back into growth initiatives.
Total Gross Income for March: $3,520.04
Mediavine: Advertising Revenue Performance
Advertising remains a cornerstone of income for many established food blogs. Our partnership with Mediavine, a premium ad management platform, allows us to optimize ad placements and maximize revenue.
- Ads: $1,754.56
This figure represents our total ad revenue for the month. Despite a slight downturn in overall sessions, our ad revenue demonstrated a healthy increase, which is a testament to the robust performance of our ads and the optimization efforts by Mediavine. This positive trend underscores the value of maintaining a strong relationship with a high-quality ad network.
- RPM (Revenue Per Mille/Thousand Sessions): $41.90
- Page RPM (Revenue Per Mille/Thousand Pageviews): $36.46
March’s RPMs were particularly strong! RPM (Revenue Per Mille, or per thousand sessions) and Page RPM (Revenue Per Mille, or per thousand pageviews) are critical metrics that indicate how efficiently our website is monetizing its traffic. The increase in these rates, even with slightly lower sessions, is a fantastic indicator of improved ad performance, potentially due to higher quality ad placements, better ad fill rates, or seasonal advertiser demand. We are extremely pleased to see this positive growth in ad revenue per session.
Other Income Streams: Diversifying Revenue
Beyond display advertising, a balanced monetization strategy incorporates various other income sources, spreading risk and opening new avenues for revenue.
- Amazon Affiliates: $34.38
Affiliate marketing, particularly through Amazon Associates, allows us to earn commissions by recommending products our audience might find useful, such as kitchen tools, ingredients, or cookbooks. While a smaller component of our income, it represents a passive stream that grows as our content and audience expand.
- Facebook: $116.42 (Instagram Reels Bonus)
This income reflects a bonus received from Facebook, likely tied to the performance of Instagram Reels. Social media platforms occasionally offer creators performance-based incentives, and this bonus highlights the potential for new monetization avenues through engaging short-form video content.
- Client Work: $1,614.68 (Photography & Short Form Video)
Offering services like food photography and short-form video creation for external clients provides a significant and direct income stream. This not only leverages existing skills developed for the blog but also diversifies revenue beyond purely passive methods, contributing a substantial portion to our monthly earnings.
It’s crucial to remember that much of this income, particularly from Mediavine, operates on a “Net 65” payment schedule, meaning funds earned in March will be disbursed approximately 65 days later. Furthermore, a significant portion of this income is “passive,” meaning it’s a direct result of work previously done (e.g., publishing a recipe years ago that continues to generate ad views and affiliate sales). This passive income provides a stable foundation, allowing us to focus on future content creation and strategic growth. Importantly, every dollar earned in March has been earmarked for direct reinvestment back into the business, “BWB,” to cover ongoing operational costs and fuel further expansion.
Expenses: Fueling Growth and Operational Costs
Running a professional food blog and online business involves various essential expenses, from maintaining the website’s technical infrastructure to investing in specialized services for growth. Understanding these outgoings is key to managing profitability and making informed strategic decisions. Our expenses for March reflect a significant investment in long-term growth and operational efficiency.
- Short Pixel: $5.50
Short Pixel is an image optimization service that helps compress and deliver images efficiently without compromising quality. This small but vital expense contributes directly to faster page load times, which is crucial for user experience and a significant factor in SEO rankings. A fast website keeps visitors engaged and signals to search engines that our site is high-quality.
- BigScoots: $59.95 (web host)
Our web hosting service, BigScoots, is a foundational expense. Reliable, fast, and secure hosting is paramount for any online business. It ensures our website is always accessible to users, can handle traffic spikes, and provides a stable environment for all our content, directly impacting site performance and SEO.
- TopHatRank: $2,600 (on & off site SEO)
This substantial investment in TopHatRank covers both on-site and off-site SEO strategies. On-site SEO involves optimizing elements directly on our website (content, keywords, technical structure), while off-site SEO primarily focuses on building high-quality backlinks. The backlinks secured by TopHatRank in February were completed in the first half of March, and we’re already starting to see initial movements in rankings for those target posts. SEO, particularly backlink building, is a long-game strategy, and we anticipate seeing more significant and measurable results from this investment over the next 2-3 months as Google indexes these new signals.
- Pinterest VA: $595.00
Our investment in a Pinterest Virtual Assistant (VA) more than doubled this month as we completely outsourced all pin creation. This strategic move aims to revitalize our Pinterest presence, leveraging expert knowledge and dedicated time that we previously couldn’t commit ourselves. We’ve made a significant financial commitment here, and our expectation is to see a tangible return on investment within 4-5 months. If we don’t observe the desired results by then, we will re-evaluate this strategy and potentially shift our focus away from the platform entirely.
- Accountant: $800.00 (2021 BWB & personal taxes)
Professional accounting services are indispensable for managing the complexities of business and personal taxes. This expense covers the preparation and filing of our 2021 business taxes for BWB and our personal taxes, ensuring compliance and accurate financial reporting, which is critical for long-term business health.
- Groceries: $153.88 (only about half of the month)
As a food blog, groceries are a direct cost of doing business, specifically for recipe development, testing, and photography. This figure represents approximately half of our monthly grocery expenses dedicated to content creation, highlighting the tangible costs involved in producing the core content for our audience.
While the full grocery expenses for the entire month aren’t included in this specific total, this list provides a comprehensive and accurate estimate of our operational costs. It underscores a key principle in the world of content creation: blogging is truly a “slow burn.” Strategic investments, especially in areas like advanced SEO and specialized virtual assistance, often take months to yield visible results. It requires patience, consistent effort, and a willingness to evaluate and adapt strategies based on long-term performance data.
What We Focused On in March: Strategic Initiatives and Content Development
March was a month of intentional strategic shifts and heightened content production. Our focus was on diversifying content types, optimizing our workflow, and exploring new avenues for audience engagement. These initiatives were designed to address current trends and lay groundwork for future growth.
- Diversified Content Strategy with Informational and Roundup Posts:
Beyond our core recipe content, we initiated the creation of more informational food posts and comprehensive recipe roundups. This strategy aims to broaden our keyword reach, attract a wider audience searching for food-related knowledge (e.g., “how to store produce,” “best kitchen gadgets”), and provide additional value to our existing readership. Roundup posts, in particular, are excellent for internal linking and can capture traffic for broader search terms.
- Complete Outsourcing of Pin Creation for Pinterest:
Recognizing that Pinterest, while potentially powerful, was not an area of personal enjoyment or efficient use of time, we made the decision to completely outsource all pin creation. This move reflects a commitment to focusing our energy on tasks we excel at and delegating others to specialists. The expectation is that dedicated, professional pin creation will yield better results, and if not, we are prepared to pivot our strategy away from the platform entirely, demonstrating a pragmatic approach to platform investment.
- Embraced a Flexible Content Production Schedule:
A key success for March was adopting a more flexible daily schedule, a departure from a previously rigid routine. This approach proved highly effective in mitigating burnout and fostering a more sustainable work-life balance. The tangible outcome was impressive: we successfully published a total of 13 new blog posts during the month, significantly boosting our content velocity and providing fresh material for our audience and search engines.
- Re-engagement with Web Stories:
After a hiatus primarily focused on video content, we are actively reintroducing Web Stories into our content strategy. Web Stories offer a unique, visually-driven, and highly engaging format that can capture attention and drive traffic from Google Discover. To streamline the process and make it more efficient, we developed a new template. Our ambitious goal is to produce two new Web Stories per week, leveraging their potential for rapid content consumption and discoverability.
- New Website Refresh on Staging Site:
My husband and I embarked on an exciting project: developing a refreshed version of the website on a staging environment. This significant undertaking involves modernizing the design, enhancing user experience, and potentially improving site speed and functionality. The aim is to eventually push these changes live, providing our audience with an updated, more intuitive, and visually appealing platform that supports our growing content library and brand evolution.
Key Takeaways from March: Lessons Learned and Insights Gained
Every month provides invaluable lessons that refine our approach to content creation, monetization, and audience engagement. March offered several key insights that will inform our strategies going forward:
- Casual Video Content Proves Effective:
A significant learning point was the realization that “good enough” casual video content is indeed sufficient for maintaining strong engagement. By simply capturing quick, authentic clips while cooking and assembling them without extensive editing, we observed no noticeable difference in audience interaction compared to more heavily produced videos. This insight is liberating, allowing for quicker content turnaround and a more sustainable video strategy without sacrificing engagement.
- RPMs Show Consistent Growth Over Time:
Our experience with Mediavine continues to demonstrate that RPMs (Revenue Per Mille) tend to increase steadily over time. Since integrating with Mediavine in mid-January, we’ve witnessed a consistent upward trend in our ad revenue per session. This reinforces the understanding that establishing a long-term relationship with a quality ad network, coupled with consistent content and traffic, leads to improved monetization efficiency as the platform optimizes ad delivery and advertiser demand adjusts.
- Flexibility Prevents Burnout and Boosts Productivity:
Perhaps one of the most crucial personal and business takeaways is the profound benefit of embracing flexibility over a rigid schedule. Maintaining a fluid and adaptive approach to daily tasks and content planning has proven to be an effective antidote to burnout. This mental well-being directly translated into increased productivity, as evidenced by our ability to publish more posts in March. Prioritizing flexibility ensures sustainability and longevity in the demanding world of content creation.
Goals for April: Charting Our Course for Continued Growth
Building on the insights and momentum from March, our goals for April are strategically designed to sustain growth, enhance content output, and further engage our audience across various platforms. Consistency and diversification remain at the forefront of our plans.
- Increase Blog Post Publication:
Our primary goal is to publish even more blog posts in April than we did in March. This commitment to increased content velocity is driven by the understanding that fresh, high-quality content is a cornerstone of organic search growth, attracting new readers, and keeping our existing audience engaged. A robust content calendar is key to achieving this.
- Maintain Consistency with Short-Form Videos:
Given the proven engagement of casual video content, we aim to continue producing and distributing short-form videos consistently. These bite-sized visual pieces are essential for connecting with audiences on social media platforms, leveraging current consumption trends, and adding a dynamic layer to our recipe content.
- Stay Consistent with Web Stories:
Following our re-engagement strategy, a critical goal for April is to maintain consistent publication of Web Stories. By regularly creating and sharing these immersive visual narratives, we aim to maximize their potential for discoverability, particularly through Google Discover, and drive additional qualified traffic back to our main blog posts. Consistency here is key to building an audience for this format.
April promises to be another month of dedicated effort, strategic execution, and continuous learning as we strive to grow our food blog into an even more valuable resource for our expanding community of readers.